
Rental housing affordability challenges are at an all-time high, particularly for low-income households and households of color, according to The State of Nation’s Housing 2024 report recently published by Harvard University’s Joint Center for Housing Studies (JCHS). The report attributes this unprecedented housing unaffordability to several factors, including a growing shortage of low-rent units.
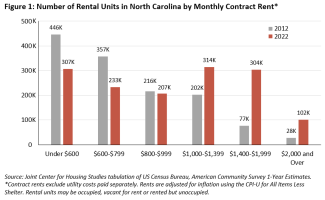
While the number of low-rent units has decreased in nearly every state (47) between 2012 and 2022, North Carolina has experienced the third largest decrease in the number of low-rent units and the eighth largest percentage decrease[i]. Between 2012 and 2022, North Carolina lost 31% of units with rents under $600 (a loss of 139,000 units) and 35% of units with rents between $600 and $799 (a loss of 124,000 units) when adjusted for inflation. Meanwhile, the number of units with rents between $1,400 and $1,999 and $2,000 or greater increased by 295% (227,000 units) and 262% (73,000 units), respectively[ii]. See Figure 1 below.
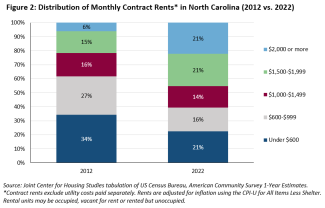
The distribution of rents in North Carolina has shifted accordingly. In 2022, 21% of units had rents below $600, down from 34% of rental units in 2012. The percentage of units with rents $2,000 or more increased from 6% to 21%. See Figure 2 below. The report attributes the decline in low-rent units to rent increases among existing units, construction of new rental units focused at the high-end of the market, tenure conversions out of the rental stock, building condemnations and demolitions.
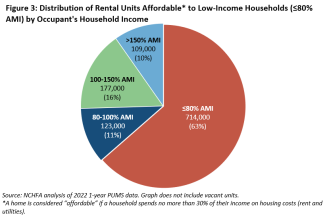
This decline in low-rent units has left low-income renters with even fewer affordable housing options over the last decade, which helps explain the high rates of housing unaffordability explored in previous Policy Matters blog posts (e.g., July 2024, December 2023, July 2023). The impact of fewer low-rent units has been compounded by the fact that a majority of the more affordable rental homes in North Carolina are being occupied by households with higher incomes, thereby reducing the number of low-rent units actually available to low-income renters. According to the NC Housing Finance Agency’s recent analysis of 2022 data from the US Census Bureau[iii], the extent of this market mismatch is substantial: 409,000 units (36%) with rents affordable to low-income renter households—those earning 80% or less of area median income[iv]—are actually occupied by renters in higher income groups who could afford to pay more. In fact, more than one-fourth of these affordable rental units (109,000 units) are occupied by households earning more than 150% of area median income. See Figure 3 below for this breakdown by income group. This trend is even more pronounced for households with extremely low incomes: 114,000 or 53% of units affordable to renter households earning 30% of area median income or less[v] are occupied by higher income households.
Consequently, higher income households have more ready access to the supply of both lower- and higher-rent homes in North Carolina’s tight rental markets. Combined with the decline in low-rent units across the state, these findings help reveal why too few low-income renter households in North Carolina can find an affordable home.
The NC Housing Finance Agency offers an array of financing options designed to help address these very challenges, including rental housing production and preservation, permanent supportive housing and rental assistance. To learn more about these investments, visit https://www.nchfa.com.
[i] Only Texas (-302,000) and Ohio (-147,000) have experienced larger decreases than North Carolina (-139,000) in the number of low-rent units in the state. Nevada (-49%), Arizona (-42%), Idaho (-41%), Texas (-40%), Colorado (-38%), Montana (-37%), and Oregon (-31%) experienced a larger percentage decrease than North Carolina (-31%).
[ii] North Carolina has outstripped national trends. From 2012 to 2022, the US lost 23% of units with rents below $600 and 35% of units with rents between $600 and $799 when adjusted for inflation. At the same time, the number of units with rents between $1,400 and $1,999 and $2,000 or greater increased by 74% and 126%, respectively.
[iii] This analysis uses data from the American Community Survey (ACS) Public Use Microdata Sample (PUMS). The ACS is an ongoing, annual survey conducted by the US Census Bureau that collects detailed population and housing data on households throughout the United States. Whereas the ACS aggregates data to a specific geography (state, county, zip code, census tracts, etc.) and releases results only in a pretabulated form, PUMS data is available at the individual and housing unit levels, offering the ability to work directly with the underlying ACS data for more complex analysis.
[iv] In 2024, 80% area median income is equivalent to an annual household income of $97,800 for a family of four in Raleigh, $58,650 in Ashe County, and $79,350 in Wilmington. For income limits for all metro areas and counties in North Carolina, see https://www.hudexchange.info/programs/home/home-income-limits/.
[v] In 2024, 30% area median income is equivalent to an annual household income of $36,700 for a family of four in Raleigh, $31,200 in Ashe County, and $31,200 in Wilmington. For income limits for all metro areas and counties in North Carolina, see https://www.hudexchange.info/programs/home/home-income-limits/.